DevOps & observability / Tutorial
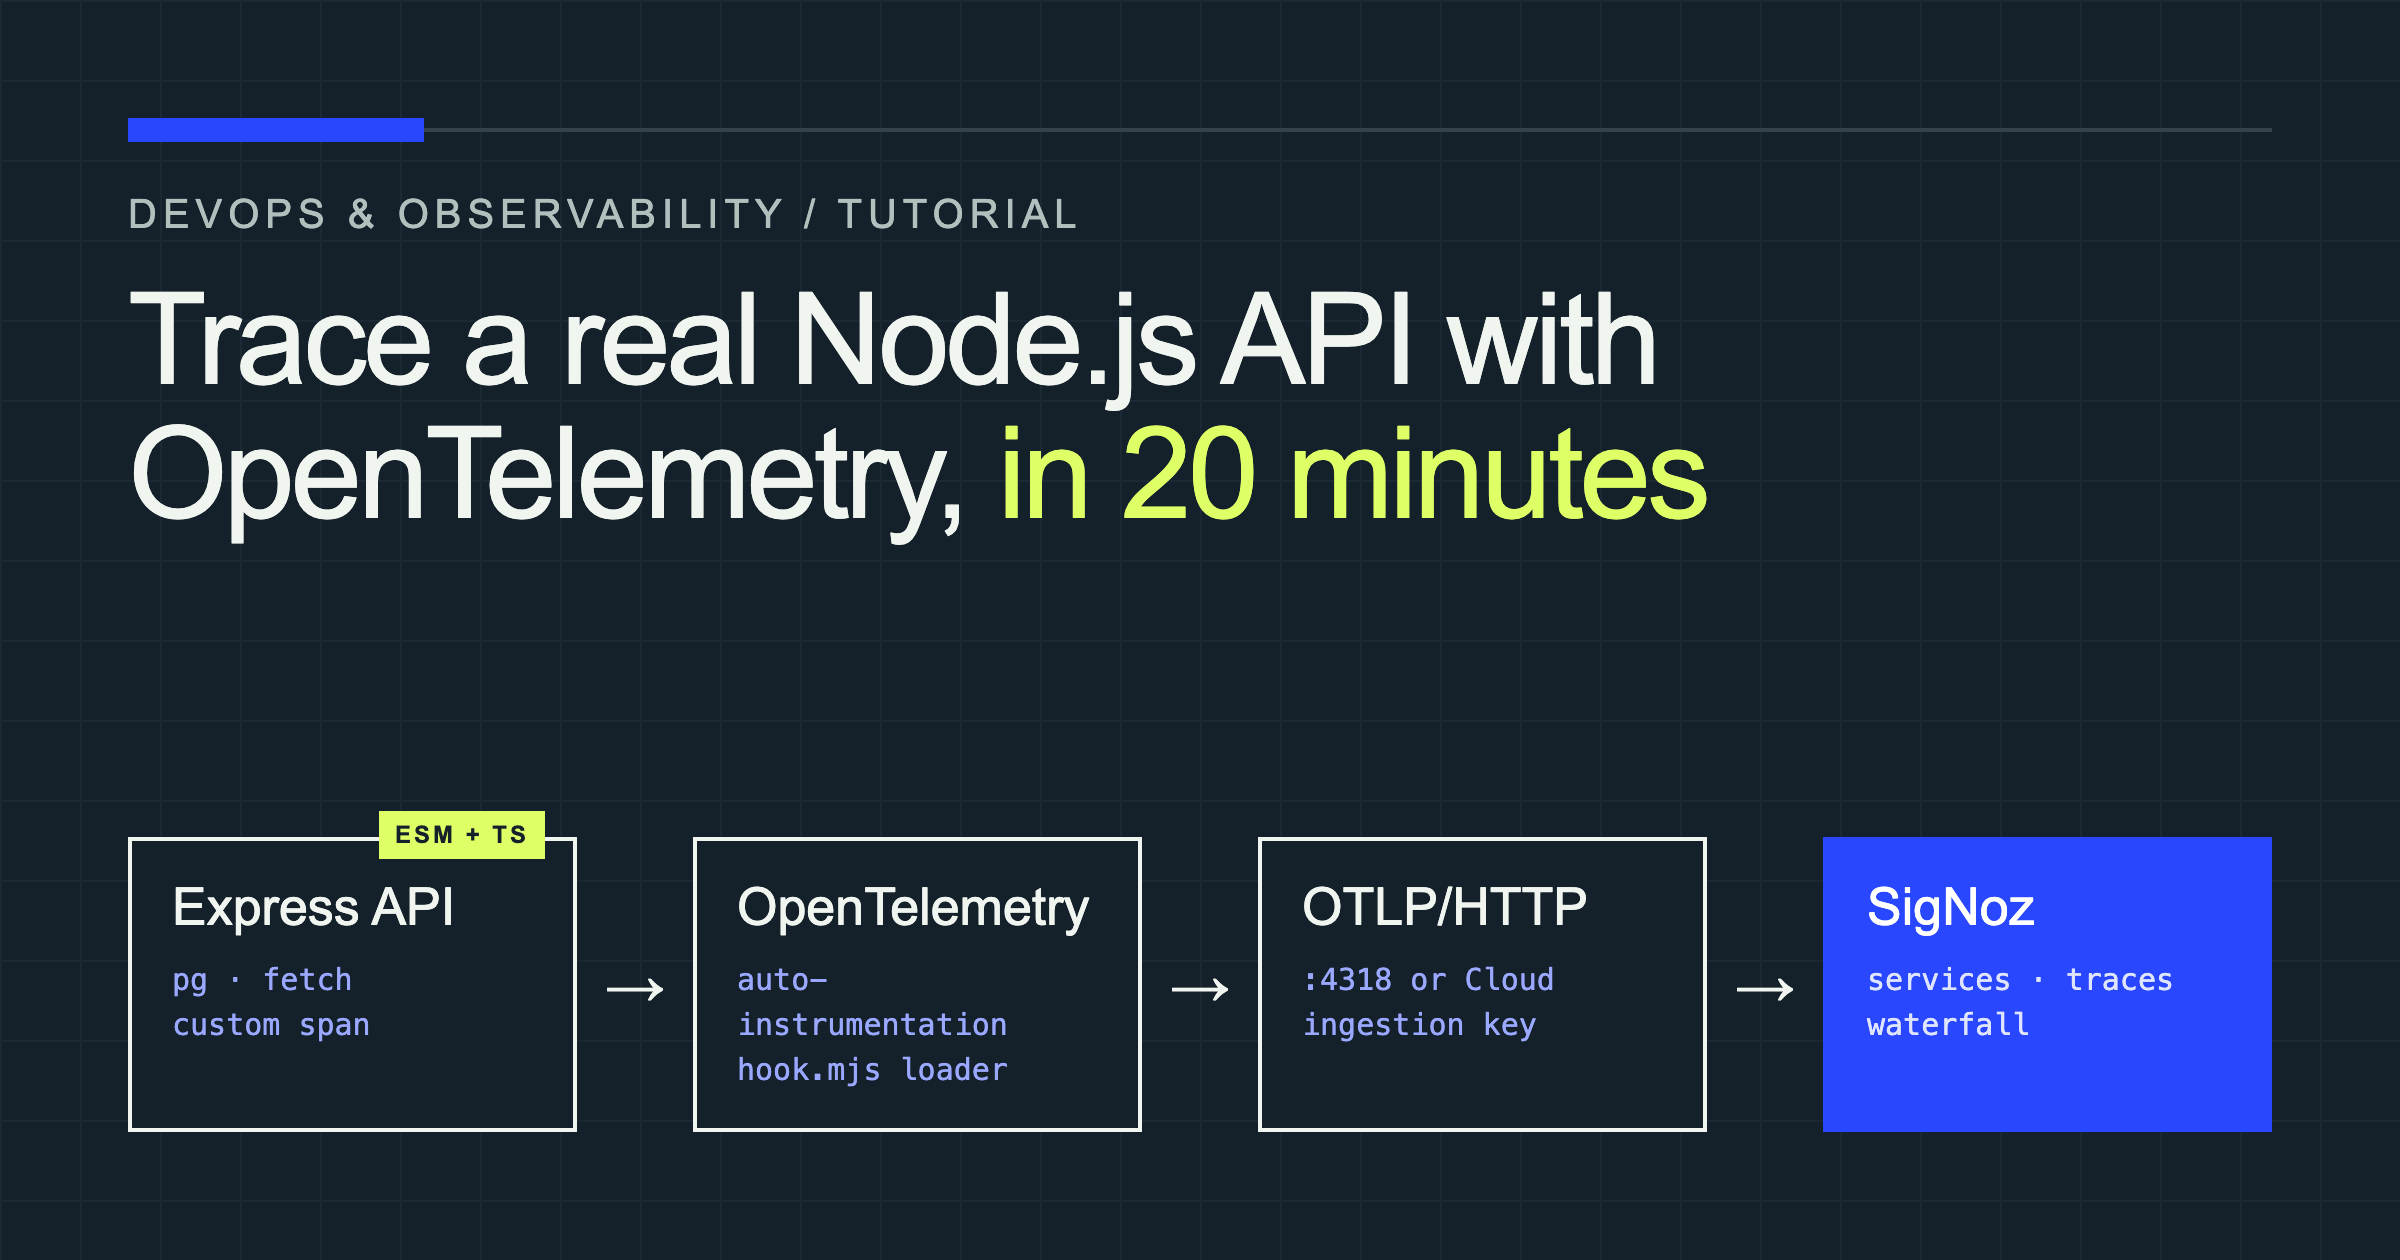
Trace a Real Node.js API with OpenTelemetry and SigNoz in 20 Minutes (ESM and TypeScript Included)
Trace Express, Postgres, outbound HTTP calls, and custom business logic with OpenTelemetry and SigNoz, including the correct ESM and TypeScript setup.
Your API is slow. That still leaves three different questions: is the route handler slow, is Postgres waiting, or is a third-party request holding everything up?
Logs can tell you that each operation happened. A trace shows how the operations fit together and how much of the request each one consumed.
In this tutorial, you will instrument a TypeScript Express API that queries Postgres and calls an external shipping service. Every request will appear as a timeline in SigNoz, including the database query, outbound HTTP request, and a custom span around business logic. We will also handle the ESM loader configuration that causes many “working” Node.js setups to silently lose their Express spans and route names.
The code here was compiled and run with Node.js 22.14.0, TypeScript 7.0.2, and Postgres 17, with traces exported over OTLP/HTTP. The OpenTelemetry packages are pinned because their JavaScript releases move frequently.
Tracing in 90 seconds
A trace is one request’s journey through a system. Each timed operation inside that journey is a span. A span has a name, start and end time, status, parent span, and attributes such as the HTTP route or database operation.
For GET /orders/1/shipping, the trace should resemble this:
GET /orders/:id/shipping
└── request handler - /orders/:id/shipping
    ├── pg.query:SELECT orders
    └── calculate-shipping-quote
        └── GET   (fetch to jsonplaceholder.typicode.com)
Those are the span names the auto-instrumentation actually emits. The outbound fetch span is named just GET; its server.address attribute holds the host.
OpenTelemetry provides the vendor-neutral API, SDK, semantic conventions, and OTLP transport. SigNoz receives the OTLP data, stores it, calculates service-level signals, and renders the waterfall. That separation matters: you can change the backend later without rewriting every instrumentation call.
Node.js API + OpenTelemetry SDK → OTLP/HTTP → SigNoz → trace waterfallPrerequisites: Cloud or self-hosted SigNoz
You need Node.js 20.6.0 or newer, npm, and Docker for the sample Postgres database. The current SigNoz Node.js guide uses the same Node minimum.
For the backend, choose one route:
- SigNoz Cloud is the fastest path. Create an account, select your region, and copy the ingestion key from the setup screen.
- Self-hosted SigNoz gives you control but needs more time and at least 4 GB allocated to Docker. The current Docker installation uses SigNoz Foundry; older bundled Compose instructions are deprecated.
| Task | Time |
|---|---|
| Create and start the sample API | 4 minutes |
| Add auto-instrumentation | 4 minutes |
| Generate and inspect traces | 4 minutes |
| Add a custom span | 5 minutes |
| Filter and explore | 3 minutes |
Step 1: Build a realistic sample API
Create the project and install the application dependencies:
mkdir signoz-orders-api && cd signoz-orders-api
npm init -y
npm pkg set type=module
npm install express@5.3.0 pg@8.23.1
npm install @opentelemetry/api@1.9.1
npm install --save-dev typescript@7.0.2 @types/node @types/express @types/pg
mkdir src
Create tsconfig.json:
{
  "compilerOptions": {
    "target": "ES2022",
    "module": "NodeNext",
    "moduleResolution": "NodeNext",
    "rootDir": "src",
    "outDir": "dist",
    "strict": true,
    "skipLibCheck": true
  },
  "include": ["src/**/*.ts"]
}
Start Postgres with this small Compose file:
services:
  postgres:
    image: postgres:17-alpine
    environment:
      POSTGRES_DB: orders
      POSTGRES_USER: postgres
      POSTGRES_PASSWORD: postgres
    ports: ["5432:5432"]
    volumes:
- ./init.sql:/docker-entrypoint-initdb.d/init.sql:roCREATE TABLE orders (
id integer GENERATED ALWAYS AS IDENTITY PRIMARY KEY,
customer_tier text NOT NULL,
total_cents integer NOT NULL,
status text NOT NULL
);
INSERT INTO orders (customer_tier, total_cents, status) VALUES
('gold', 12900, 'paid'),
('standard', 4900, 'packed');Create src/app.ts:
import { SpanStatusCode, trace } from "@opentelemetry/api";
import express from "express";
import pg from "pg";

const pool = new pg.Pool({ connectionString: process.env.DATABASE_URL });
const tracer = trace.getTracer("orders-api.business", "1.0.0");
const app = express();

app.get("/orders", async (_req, res, next) => {
  try {
    const result = await pool.query(
      "SELECT id, customer_tier, total_cents, status FROM orders ORDER BY id",
    );
    res.json(result.rows);
  } catch (error) { next(error); }
});

app.get("/orders/:id/shipping", async (req, res, next) => {
  try {
    const result = await pool.query(
      "SELECT id, customer_tier FROM orders WHERE id = $1",
      [req.params.id],
    );
    const order = result.rows[0];
    if (!order) return res.status(404).json({ error: "Order not found" });

    const quote = await calculateShipping(order);
    res.json({ orderId: order.id, ...quote });
  } catch (error) { next(error); }
});

app.get("/slow", async (_req, res) => {
  await new Promise((resolve) => setTimeout(resolve, 900));
  res.json({ delayedMs: 900 });
});

app.listen(3000, () => console.log("Orders API listening on :3000"));
The shipping route calls calculateShipping, which you will trace in Step 4. Until then, add this stub at the bottom of app.ts, or TypeScript stops with Cannot find name 'calculateShipping':
// Temporary stub: Step 4 replaces this with a traced implementation.
async function calculateShipping(order: { id: number; customer_tier: string }) {
  return { priceCents: order.customer_tier === "gold" ? 0 : 799, carrierReference: 0 };
}
Start Postgres with docker compose up -d, then compile with npx tsc.
Step 2: Add zero-code OpenTelemetry instrumentation
Install the pinned auto-instrumentation package and its ESM loader dependency:
npm install @opentelemetry/auto-instrumentations-node@0.81.2 \
  @opentelemetry/instrumentation@0.223.0
Create .env for SigNoz Cloud:
DATABASE_URL=postgres://postgres:postgres@localhost:5432/orders
OTEL_SERVICE_NAME=orders-api
OTEL_RESOURCE_ATTRIBUTES=service.version=1.0.0,deployment.environment.name=development
OTEL_TRACES_EXPORTER=otlp
OTEL_METRICS_EXPORTER=none
OTEL_LOGS_EXPORTER=none
OTEL_EXPORTER_OTLP_PROTOCOL=http/protobuf
OTEL_EXPORTER_OTLP_ENDPOINT=https://ingest.<region>.signoz.cloud:443
OTEL_EXPORTER_OTLP_HEADERS=signoz-ingestion-key=<your-ingestion-key>
OTEL_NODE_RESOURCE_DETECTORS=env,host,os,process
NODE_OPTIONS=--experimental-loader=@opentelemetry/instrumentation/hook.mjs --import @opentelemetry/auto-instrumentations-node/register
OTEL_SERVICE_NAME is the name you will search for in SigNoz. Resource attributes describe the producing service; use a new service.version for every build because SigNoz uses changes to create deployment markers. The exporter variables select OTLP/HTTP and its destination. The header authenticates Cloud requests.
For self-hosted SigNoz, use OTEL_EXPORTER_OTLP_ENDPOINT=http://localhost:4318 and remove OTEL_EXPORTER_OTLP_HEADERS. Port 4318 is OTLP/HTTP; 4317 is OTLP/gRPC. The self-hosted ingestion guide documents both.
Add these scripts and start the service:
{
  "scripts": {
    "build": "tsc",
    "start": "node --env-file=.env dist/app.js"
  }
}
npm run build
npm startThe loader and register module run before dist/app.js, allowing OpenTelemetry to patch Express, pg, and outbound HTTP before the application imports them.
Step 3: Find the slow request in SigNoz
Generate a few traces:
for id in 1 2 3; do
  curl -s http://localhost:3000/orders > /dev/null
  curl -s http://localhost:3000/orders/1/shipping > /dev/null
  curl -s http://localhost:3000/slow > /dev/null
done
In SigNoz, open Services and select orders-api. The overview shows request rate, error rate, and latency. Open Traces, filter by service.name = orders-api, and select a /orders/1/shipping request.
The waterfall should contain the inbound HTTP/Express work, a Postgres client span, and an outbound HTTP span. The nesting answers the question logs could not: how much time belonged to your code, the database, and the external service?
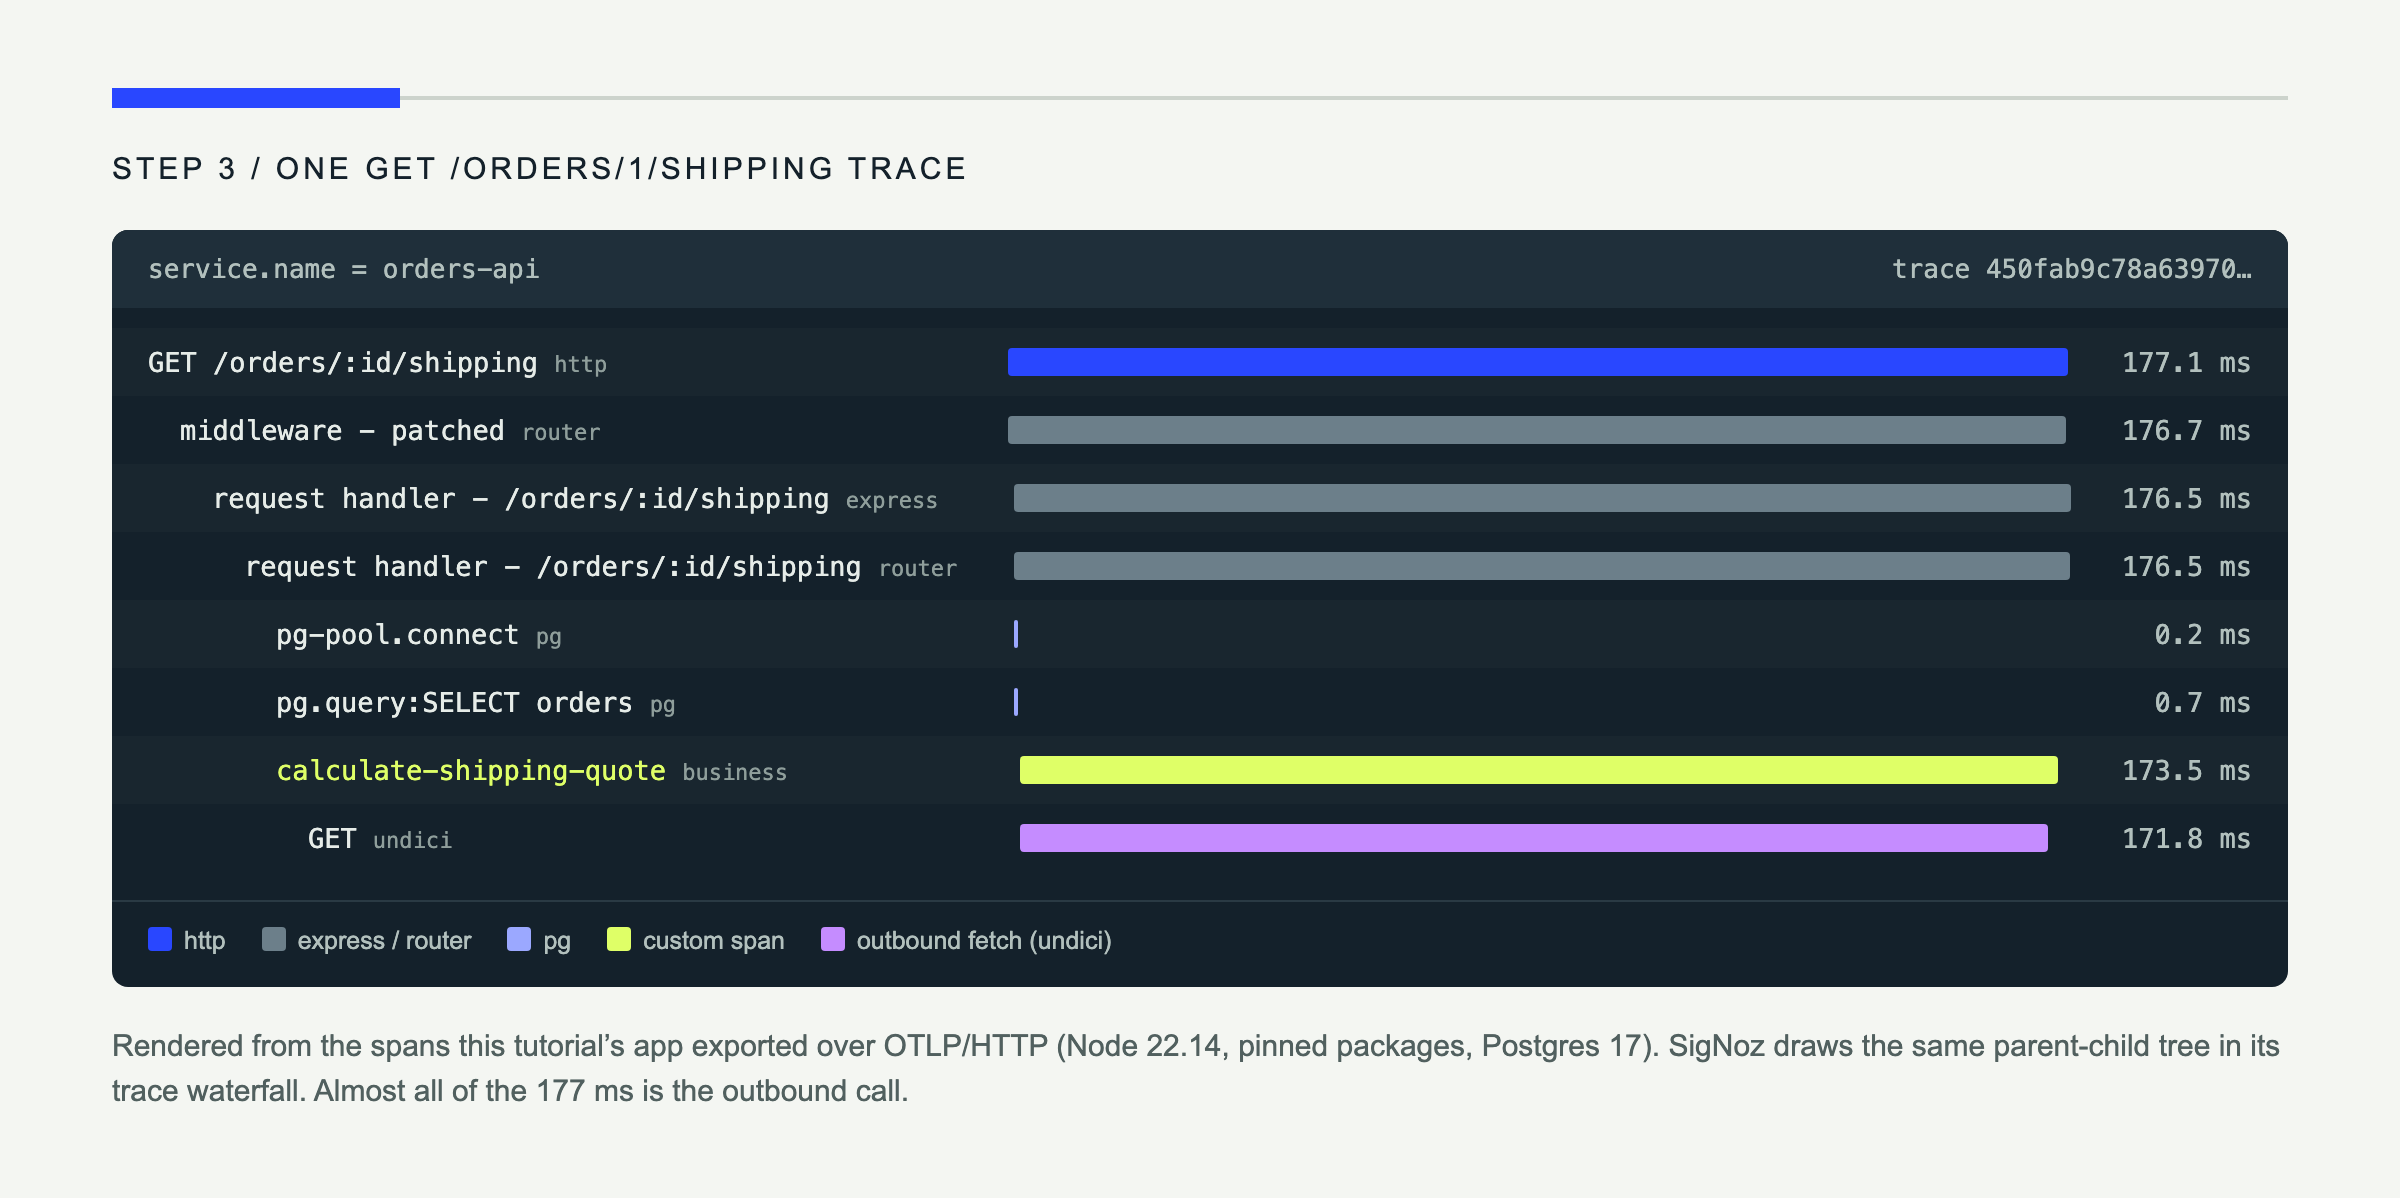
Here the database query took under a millisecond; almost the entire request was the external call. Expect two request handler spans per route: Express 5 delegates to the router package, and both are instrumented.
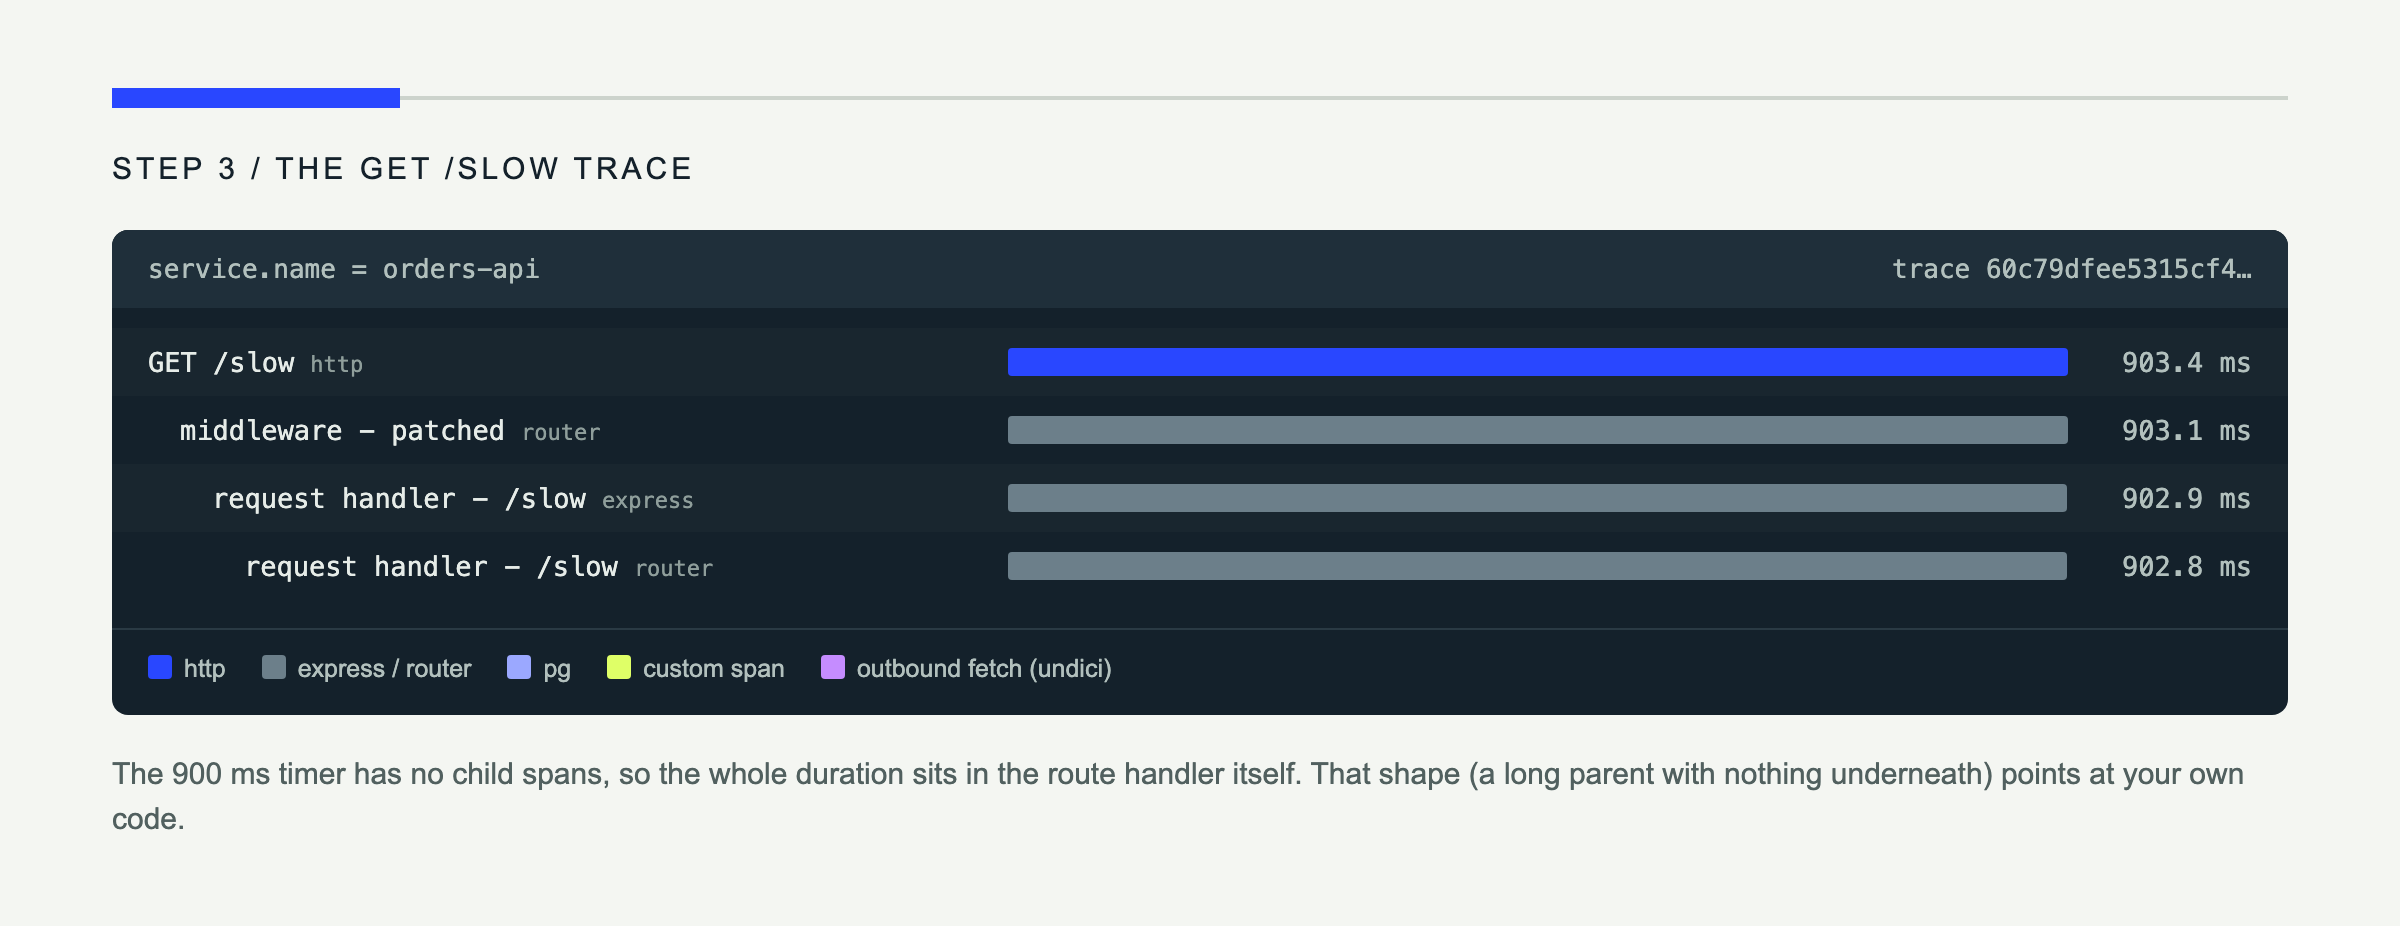
Now filter by the /slow route. Its roughly 900 ms server span should stand out immediately. Open the span to inspect its duration, status, resource data, and HTTP attributes.
Step 4: Add business context with a custom span
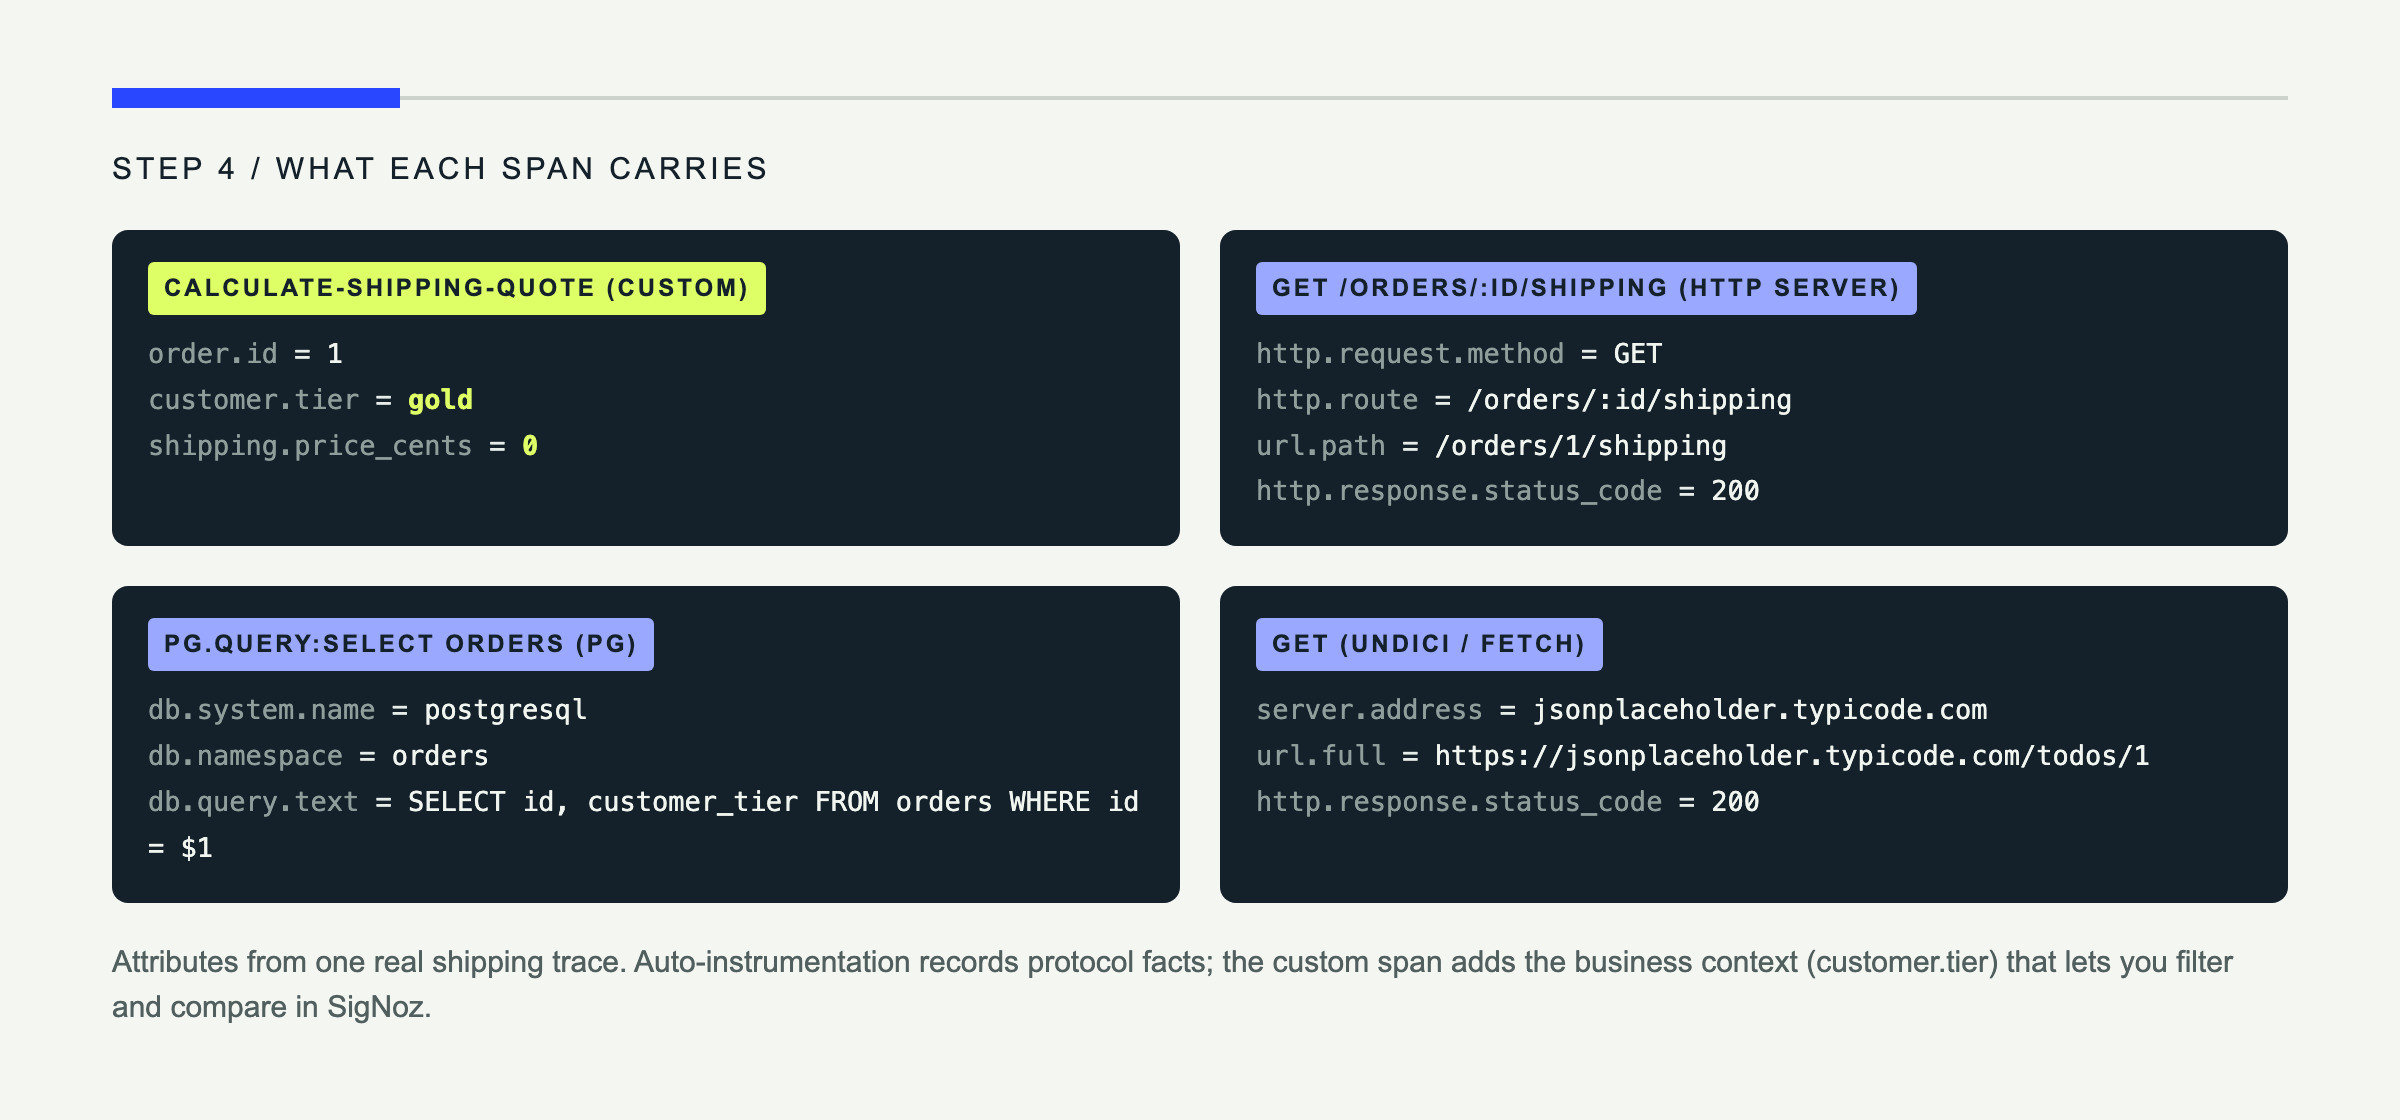
Auto-instrumentation understands frameworks and clients. It does not know that a block of code calculates a shipping quote or that gold customers receive free delivery.
Replace the stub with this traced version:
async function calculateShipping(order: { id: number; customer_tier: string }) {
  return tracer.startActiveSpan("calculate-shipping-quote", async (span) => {
    try {
      span.setAttribute("order.id", String(order.id));
      span.setAttribute("customer.tier", order.customer_tier);

      const response = await fetch(
        "https://jsonplaceholder.typicode.com/todos/1",
      );
      if (!response.ok) {
        throw new Error(`Shipping API returned ${response.status}`);
      }

      const carrier = await response.json() as { id: number };
      const priceCents = order.customer_tier === "gold" ? 0 : 799;
      span.setAttribute("shipping.price_cents", priceCents);
      span.setStatus({ code: SpanStatusCode.OK });
      return { priceCents, carrierReference: carrier.id };
    } catch (error) {
      span.recordException(error as Error);
      span.setStatus({
        code: SpanStatusCode.ERROR,
        message: error instanceof Error ? error.message : String(error),
      });
      throw error;
    } finally {
      span.end();
    }
  });
}
startActiveSpan makes auto-instrumented work inside the callback a child of the business span. Always end a manual span in finally; record and rethrow errors so both the span and Express see the failure. The SigNoz manual-instrumentation guide follows the same pattern.
Rebuild, restart, and call the shipping route again. In Traces, filter for the calculate-shipping-quote span and add customer.tier = gold. You can now compare shipping latency by business segment.
The ESM and TypeScript trap
Many Node tutorials use this CommonJS preload:
node --require @opentelemetry/auto-instrumentations-node/register app.jsThat is correct for CommonJS. It is incomplete for an application compiled as ESM. On Node 20, preloading your own ESM tracing file with -r commonly fails with ERR_REQUIRE_ESM. Newer Node 22 releases can synchronously load some ESM files, so the process may start—but imported packages can still be missing spans because CommonJS and ESM use different module loaders.
Running this tutorial’s compiled app both ways shows how quiet the failure is. With --require alone, the app starts, Postgres and fetch are still traced, but every Express span disappears and each server span is named just GET, without its route:
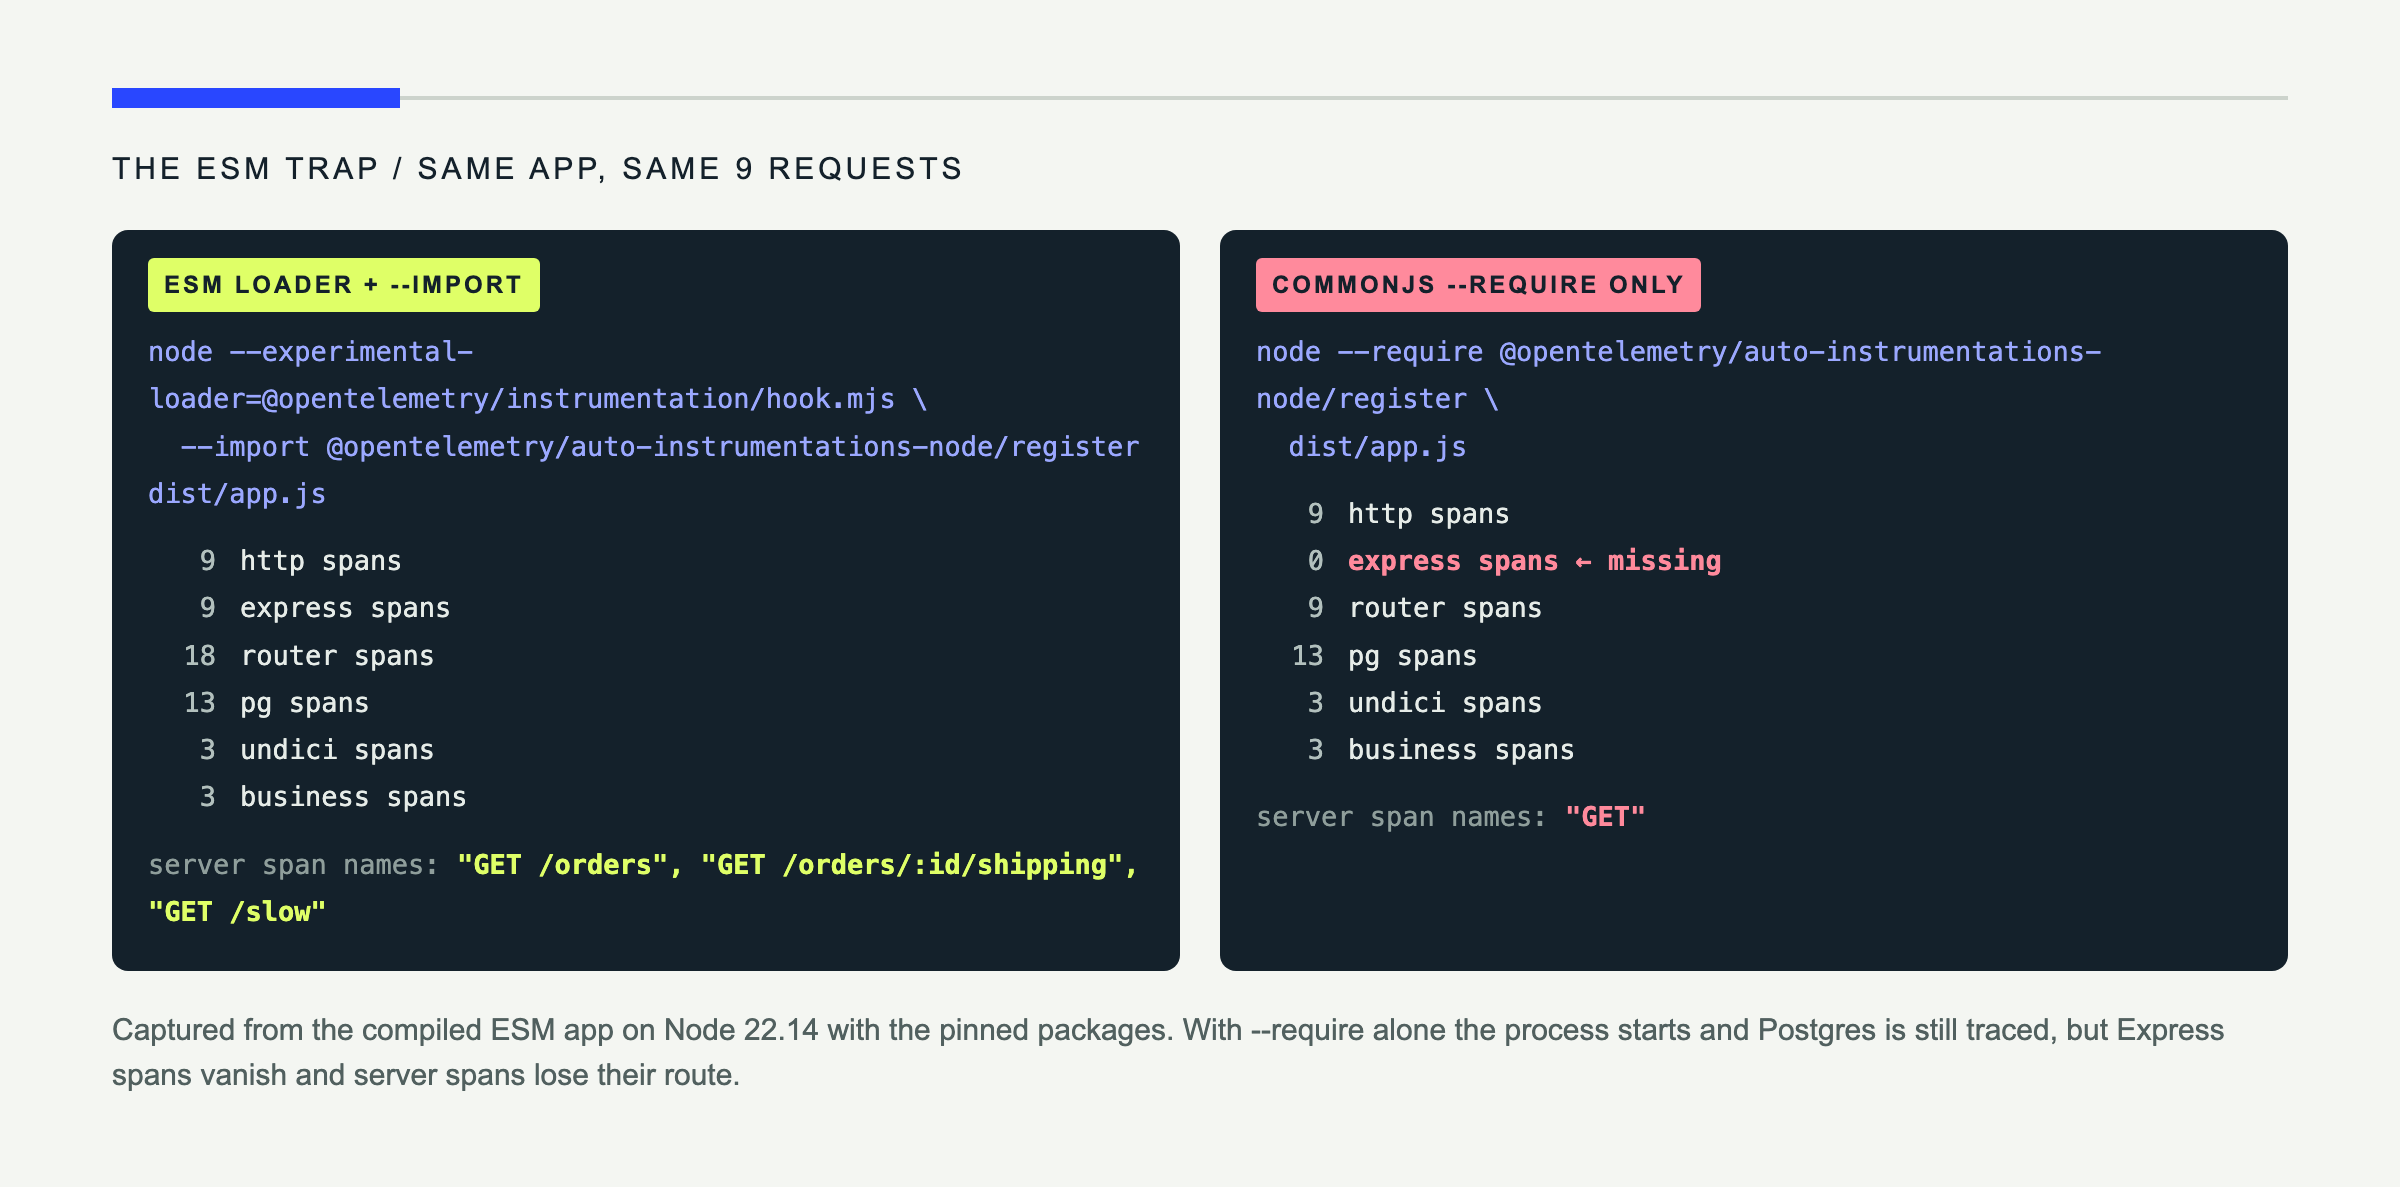
The supported ESM setup has two pieces: --import initializes the SDK before the app, while the OpenTelemetry loader hook patches modules loaded through import. The official OpenTelemetry ESM support guide gives this zero-code command:
node --experimental-loader=@opentelemetry/instrumentation/hook.mjs \
  --import @opentelemetry/auto-instrumentations-node/register \
  dist/app.js
If you need programmatic control, install @opentelemetry/sdk-node@0.223.0 and @opentelemetry/exporter-trace-otlp-http@0.223.0, create src/tracing.ts, and compile it with the application:
import { getNodeAutoInstrumentations } from "@opentelemetry/auto-instrumentations-node";
import { OTLPTraceExporter } from "@opentelemetry/exporter-trace-otlp-http";
import { NodeSDK } from "@opentelemetry/sdk-node";

export const sdk = new NodeSDK({
  traceExporter: new OTLPTraceExporter(),
  instrumentations: [getNodeAutoInstrumentations()],
});

sdk.start();
process.once("SIGTERM", async () => { await sdk.shutdown(); });
Remove the auto-register NODE_OPTIONS line, then run exactly one bootstrap:
npx tsc
node --env-file=.env \
  --experimental-loader=@opentelemetry/instrumentation/hook.mjs \
  --import ./dist/tracing.js \
  dist/app.js
Compiling first removes an entire loader from the debugging path. tsx --import ./src/tracing.ts src/app.ts can be convenient, but loader composition for direct ESM TypeScript remains sensitive. SigNoz currently advises avoiding ts-node with TypeScript 7 because it can fail before the application starts.
What breaks
The service never appears
Symptom: orders-api is absent from Services. Cause: The endpoint region is wrong, the ingestion header is missing, the process cannot reach the collector, or no route has produced a span. Fix: Generate traffic and set OTEL_LOG_LEVEL=debug. Cloud uses https://ingest.<region>.signoz.cloud:443; local self-hosted OTLP/HTTP uses http://localhost:4318 without a key. The SigNoz ingestion troubleshooting tree includes checks for 404, connection refusal, and protocol/port mismatches.
HTTP arrives, but Express or Postgres spans do not
Symptom: You see a top-level request, often named only GET with no route, but no framework or database detail. Cause: Instrumentation loaded after application imports, or the ESM hook is absent. Without the hook, Express spans vanish even when Postgres spans still appear. Fix: Never import tracing from the bottom of app.ts. Preload it and, for compiled ESM, keep both --import and --experimental-loader.
Some operations appear twice
Symptom: Duplicate spans have almost identical timestamps, and Node warns The 'import-in-the-middle' hook has already been initialized. With the pinned packages, outbound fetch spans doubled while server and Postgres spans did not, which makes the problem easy to misread. Cause: NODE_OPTIONS loads the zero-code register while --import ./dist/tracing.js starts a second SDK. Fix: Choose one bootstrap. Remove the register from NODE_OPTIONS when using tracing.ts.
A short script exports nothing
Symptom: A migration or one-off worker exits successfully but sends no spans. Cause: Batch processors buffer spans and the process exits before export. Fix: With code-based setup, call await sdk.shutdown() before exit. Long-running services should also shut down on SIGTERM so deploys flush cleanly.
The trace view is noisy
Symptom: File-system, DNS, health-check, or readiness spans bury application work. Cause: The metapackage enables a broad instrumentation set. Fix: For zero-code setup, add OTEL_NODE_DISABLED_INSTRUMENTATIONS=fs,dns. For code-based setup, pass { enabled: false } for those packages to getNodeAutoInstrumentations. SigNoz’s selective instrumentation guide documents both approaches. Ignoring /health itself requires code-based HTTP instrumentation with ignoreIncomingRequestHook.
Production checklist
Before deploying, make these choices explicit:
- Sample intentionally. One hundred percent is helpful locally but expensive at sustained production traffic.
- Add
deployment.environment.name=production, or use distinct service names if your operating model requires them. - Set
service.versionfrom the image tag or commit SHA in CI. - Keep ingestion keys in the platform’s secret store, never in source control.
- Filter health checks and other predictable noise before it reaches the backend.
- Alert on p99 latency and error rate, then link alerts back to representative traces.
Wrap-up
You now have one trace that crosses Express, Postgres, an outbound HTTP request, and your own shipping logic. Auto-instrumentation supplied the infrastructure detail; the custom span added the business meaning; and the ESM loader made sure imported modules were actually patched.
The next step is to send logs and metrics through the same OpenTelemetry pipeline, correlate them with traces, and create latency and error alerts in SigNoz. After that, the same pattern can trace every call in an LLM workflow.
Every file you need is in this article: compose.yaml, init.sql, tsconfig.json, src/app.ts, .env, and the optional src/tracing.ts. If your team needs a tested tutorial or an observability docs review, work with me.