Tag
prometheus
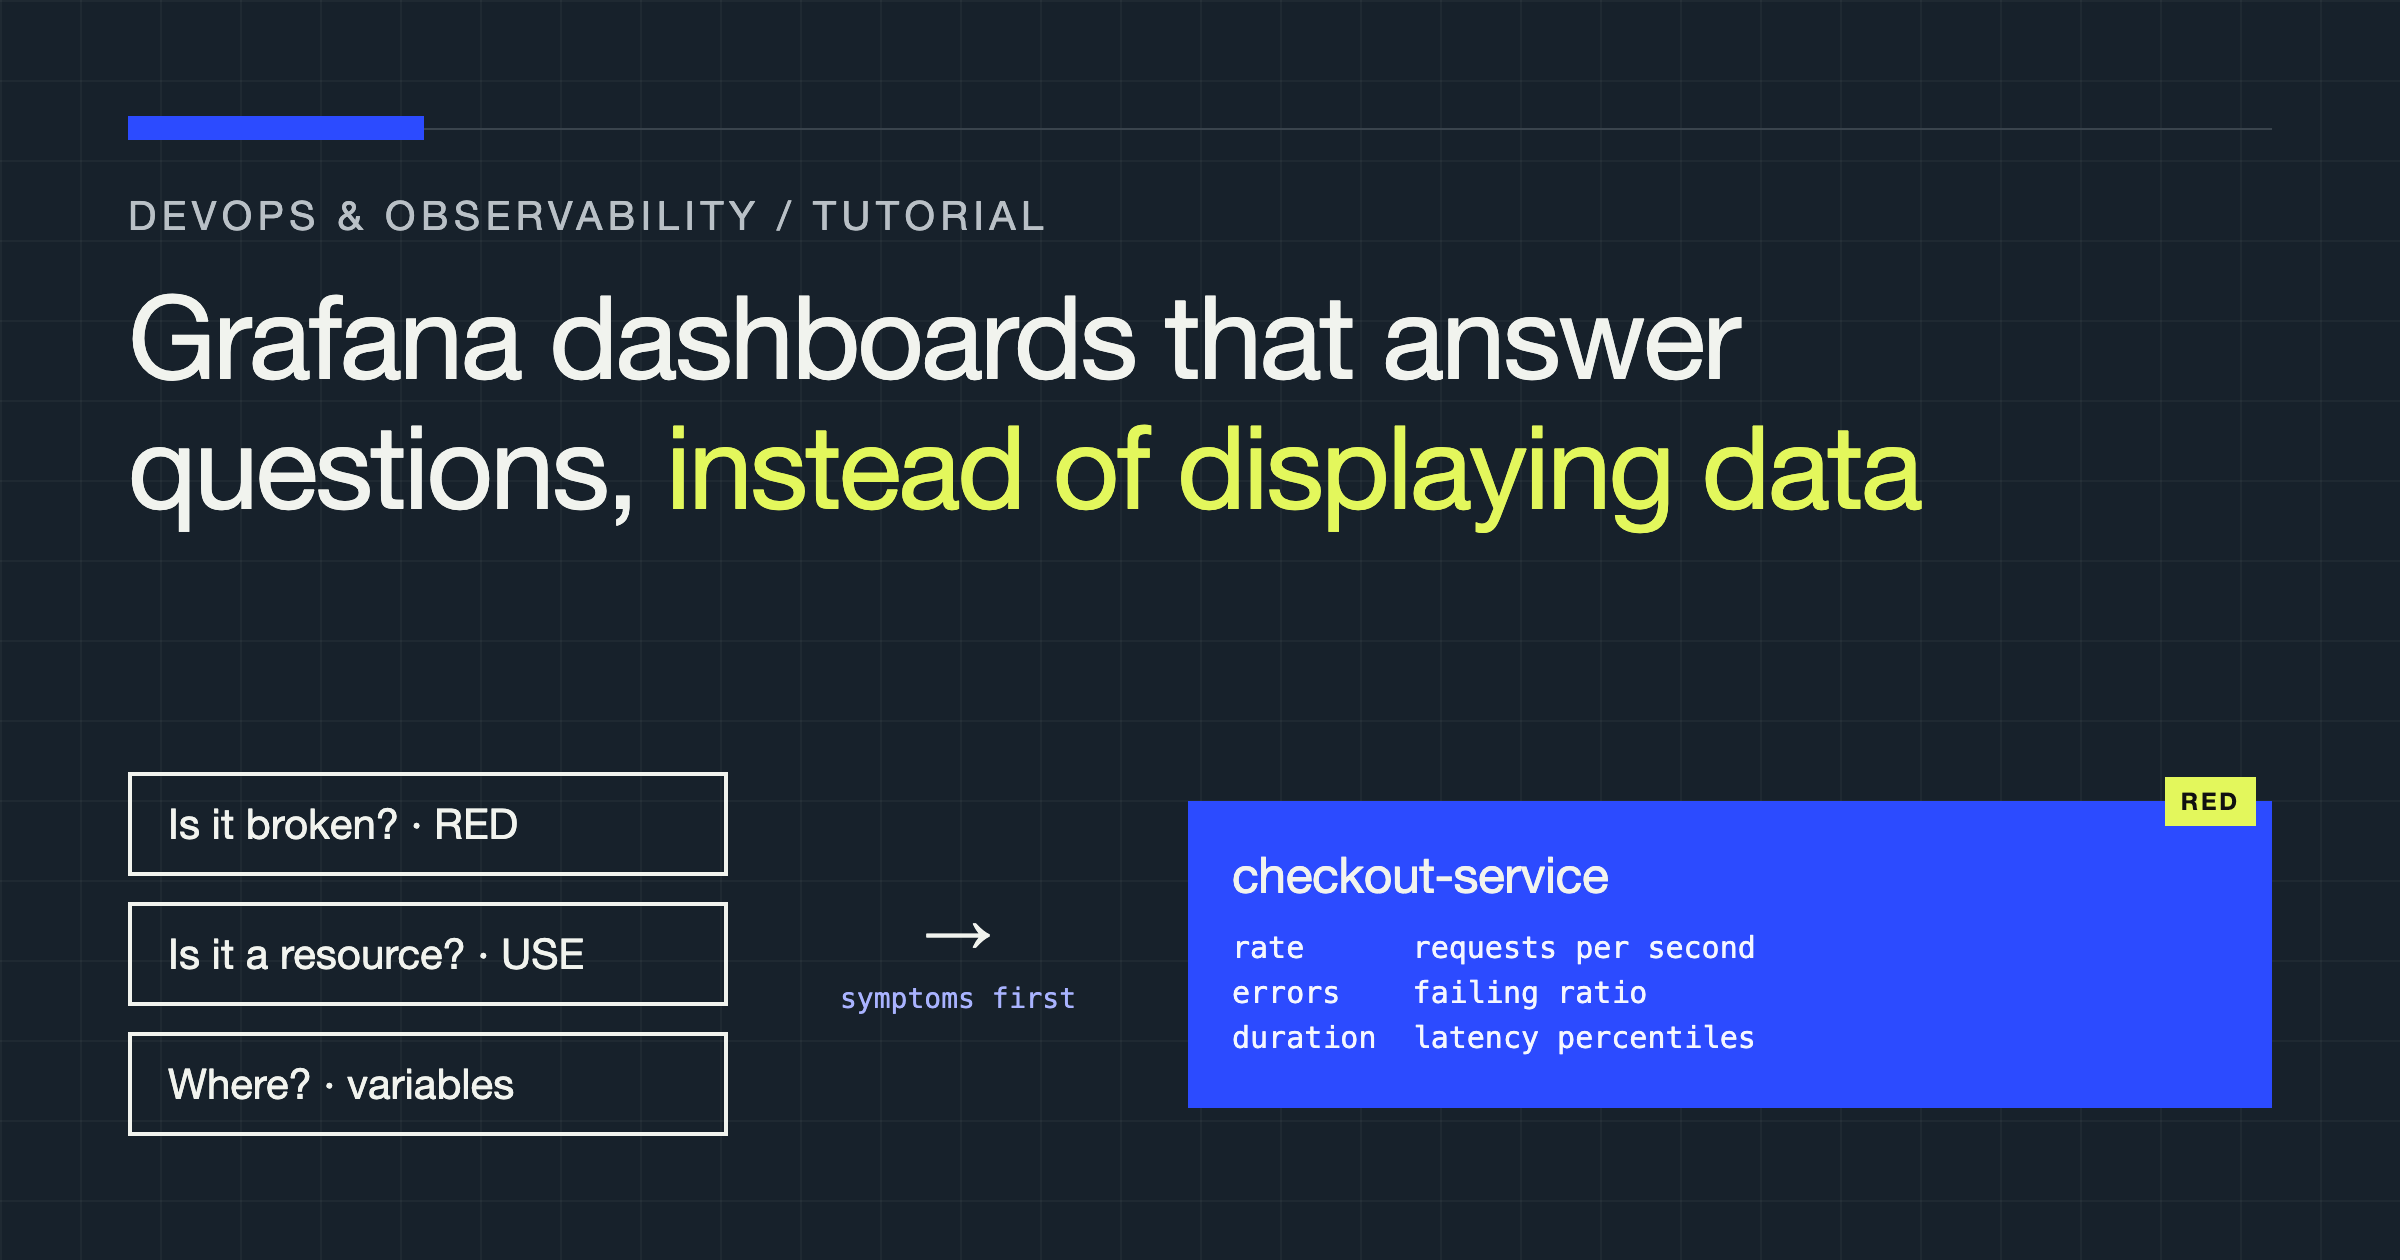
Grafana Dashboards That Answer Questions Instead of Displaying Data
Design Grafana dashboards around the questions operators actually ask: symptom-first layout, RED and USE panels, honest thresholds, and variables that narrow scope.
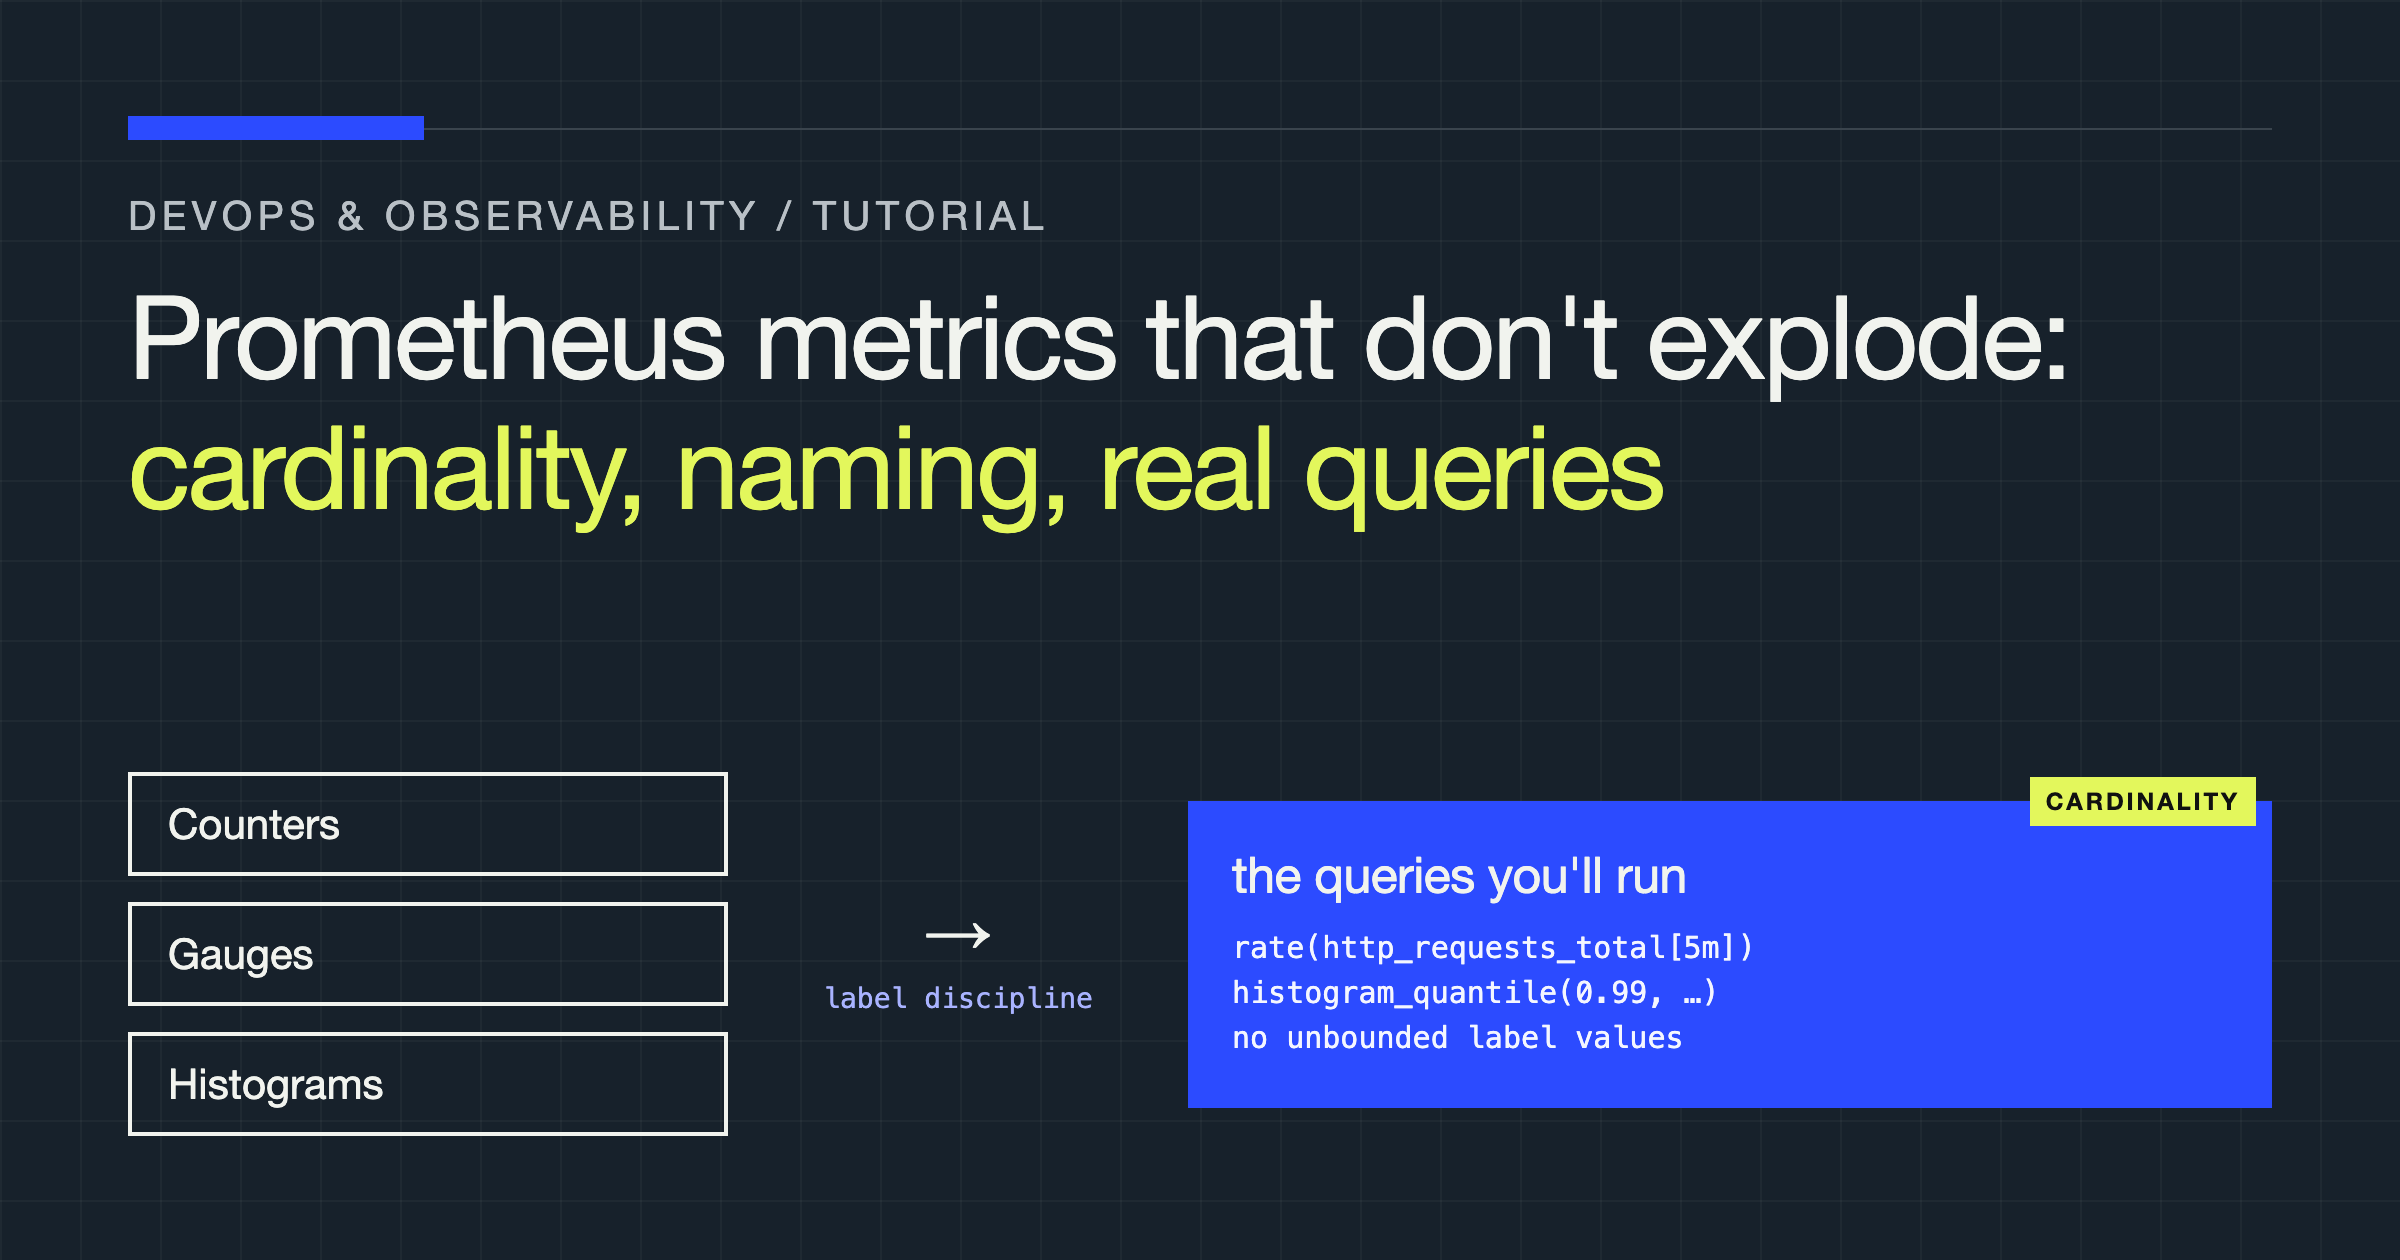
Prometheus Metrics That Don't Explode: Cardinality, Naming, and the Queries You'll Actually Run
Design Prometheus metrics that stay queryable under load: naming, label discipline, histograms, and the PromQL for errors, latency, and saturation.
No matches in this set.
Clear a filter or try another combination.